Residents in Nyborg on the coast of the Danish island of Funen can visit the municipality’s website to check out whether their house is at risk of flooding in the event of rising sea levels.
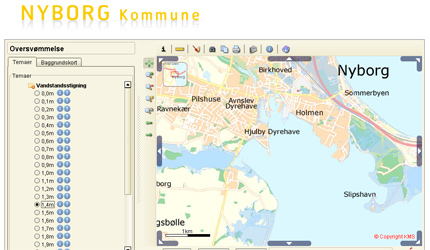
The municipality of Nyborg has a tool for analysing storm-surge
scenarios on their website. This tool can calculate which areas are
at risk of being flooded at given increases in water levels.
The user chooses a water level for which he wants the tool to
calculate a storm-surge scenario. It is possible to choose a sea
level between 0-3 meters above the normal water level. Once a level
has been chosen, the system calculates the areas which risk being
flooded at the chosen water level. The result is shown in a
map.
The user can choose which type of map the scenario will be
presented on. Furthermore, there is a zoom function for seeing a
detailed area of interest, for example one's own house.
The storm surge scenarios on the website of the municipality of
Nyborg show that large areas of Nyborg would be threatened by
flooding if water levels went up 1.4m above the current
levels.
A tool for local emergency services
The system is also being used as a planning tool for the
municipality's emergency services. The tool allows the emergency
services to improve and target their efforts in connection with
increases in water levels.
Poul Laursen, a senior emergency planning officer, explains: "When
the Danish Meteorological Institute warns about increased water
levels, we use the system to see where we might expect problems
from the expected increase. We then decide whether we want to make
sand and sand bags available for the public to use as protection
against flooding."
In line with many other Danish municipalities, the municipality of
Nyborg was hit by flooding in 2006. Since that time, the
citizens have been very aware of the risk. The storm-surge tool was
made public in 2007 in order to make the municipality and its
citizens better equipped to manage similar situations in
future.
Since 2006, the Danish Meteorological Institute has sent out
warnings of increased water levels on two occasions where the
emergency services decided to hand out sandbags. On both occasions,
citizens collected 75,000 sandbags, and on both occasions,
basements remained dry.
Poul Laursen believes the system is working as intended: "The
system helps us make early decisions before the water has passed
through for example a breach in a dike. In this way we can also
make sandbags available for people to collect at an early stage. A
service with which people are very pleased. We used to receive
complaints for not acting fast enough."
Useful in coastal protection
The municipality's technical and environmental department also uses
the tool in for coastal protection.
For example, we used the tool at a public hearing to illustrate the
effect of building a dike. The tool made it easier to illustrate
what was at risk of being flooded under current conditions, and
what would be protected by the dike," Jan Jensen from the
municipality's technical and environmental department explains.
Since the public hearing a dike has been built in a summer cottage
area at Nordenhuse north of Nyborg.
What increase in water levels?
The municipality encourages users of the tool to take account of
wave and wind direction, when choosing which water level scenario
to explore. The site says: "When choosing a water level increase,
in order to see whether you can expect a given area to become
flooded, remember to take account of the wave and wind direction.
For example: if there is a warning of a 1.0m increase in the water
level and, at the same time, there is a strong northerly wind, the
expected water level increase, including waves might be 1.6m on
coasts facing north, while on coasts facing south it might be
1.2m."
The system has been designed on the basis of a terrain model and
the areas shown are those that are below the chosen water level.
They will only be flooded, however, if the sea has access to them,
or gains access to them, e.g. due to a breach in the dike.
Furthermore, the areas will only be completely flooded if the
increased water level remains over a longer period of time, as it
takes time for the water to run into the area. Storm surges
typically only last a few hours, and for some of the areas, the
seawater will be stopped on its way by dikes or other elevations in
the terrain. So, perhaps the areas which the map indicates could be
flooded are in fact too large, compared to what will become flooded
in reality. Poul Laursen's comment on this is:
"The system is not absolutely precise. For example, the system
shows that the area by the train station will be flooded at a mere
10cm increase in water level. This is not the case in reality, and
here we need to improve the system. In reality, the extent of
flooding shown is perhaps not exactly equal to what we see on the
map. However, based on real flooding events, it is my
impression that the system provides a fairly accurate picture. And
the important thing is that the system shows us where the problems
could arise, so that we can take a decision on this basis."
The municipality describes the tool's precision and sources of
error on their website and stresses that the tool is just a guide,
and that the municipality cannot be held responsible for possible
errors in the scenarios. The tool was created in 2007 by the
municipality's former GIS coordinator, and has not been updated
since.
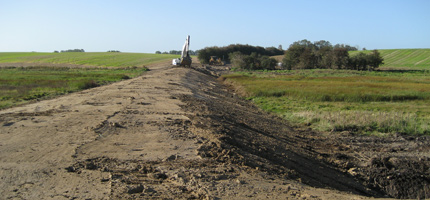
After the flooding in 2006, the residents near Drejet,
Nordenhuse, constructed a dike which protects against flooding when
water levels are high. The dike was constructed in 2008 and
measures 150m in length. After the 2006 storm surge, around 25
summer cottages were damaged due to a water level that was 1.8m
above normal. The new dike is 2.25m high (above normal water
level), and protects around 40 summer cottages from
flooding.